When you debug (rather than utilizing a debugger), do you prefer to use console.log? Or perhaps you'd like to improve the logging of your scripts or applications?
You've arrived at the right location! In this article, I'll show you some console ways that will improve your logs that you probably don't know about:)
Log with style: console.log
Okay, I'm sure you're familiar with this one. Did you realize, though, that you may stylize your text? You can do this by inserting %c before the text you want to stylize and defining the style in the following parameter (inline CSS format).
console.log(
  "%c This is a stylized text",
  "color:red;text-decoration: underline;"
);

Note: You can put multiple different stylized texts in the same log:
console.log(
  "%c This is a red text %c and a blue text",
  "color:red",
  "color:blue"
);

Note: You can do it with other logging functions like info, debug, warn, and error.
Make a quick counter: console.count
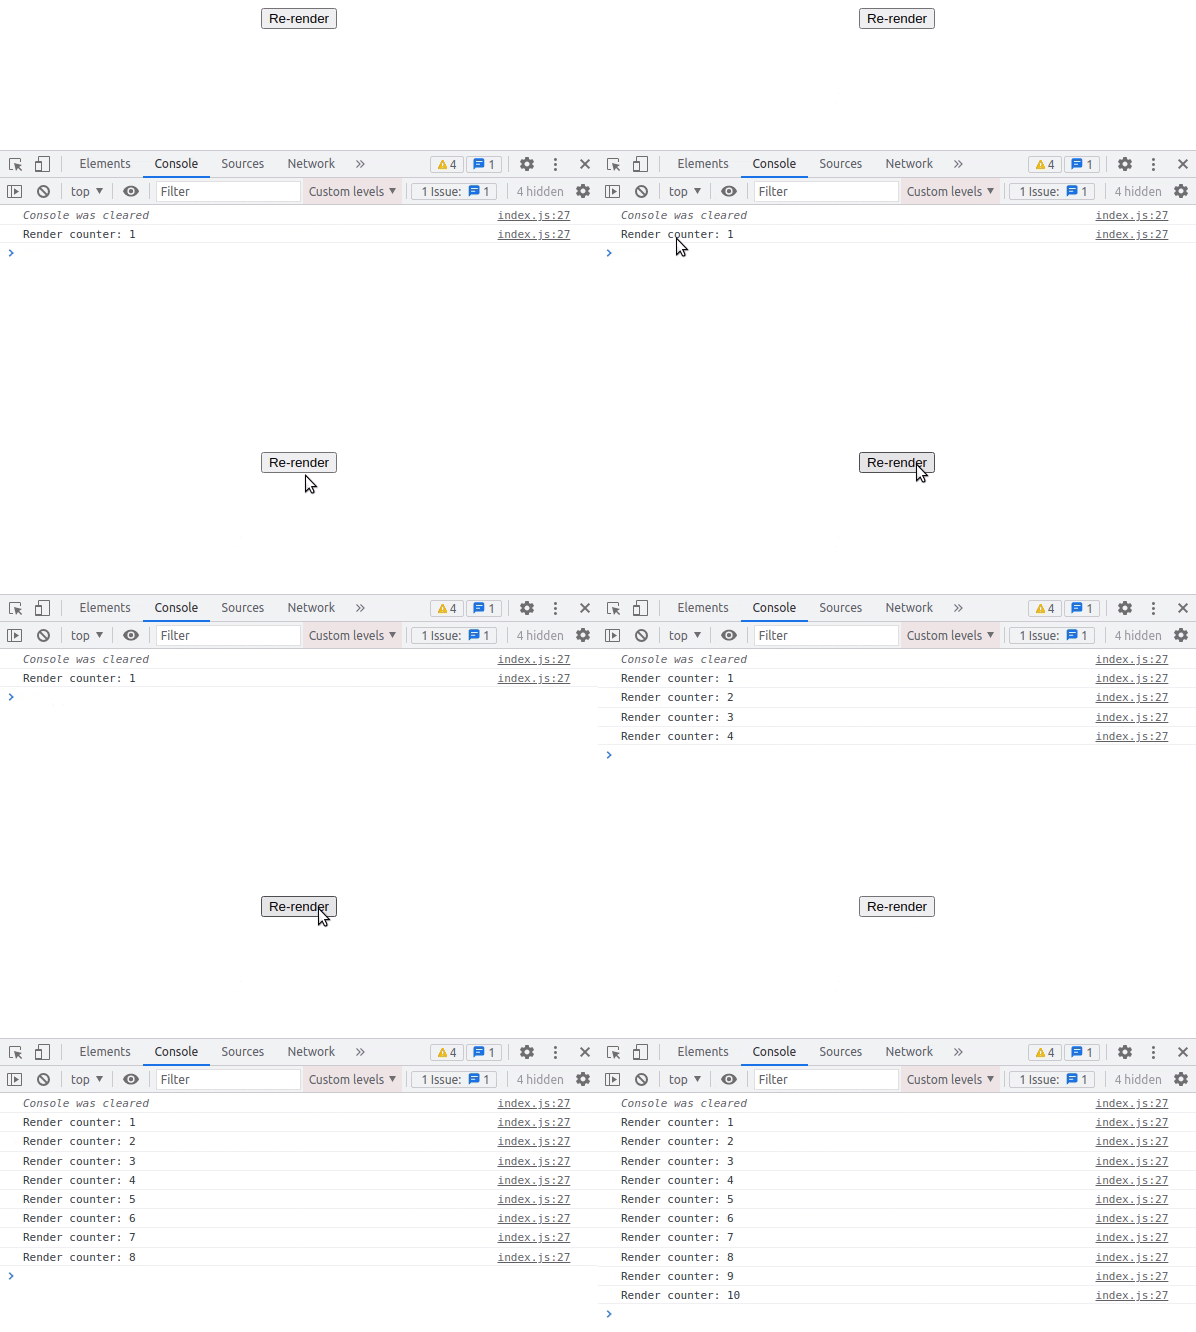
How many times have you wanted to know how many times a component renders while working with React? Yes, the React Developer Tools can show that, however, it's not fast enough for me:) As a result, a console can be used to create a counter. All thanks to the console.count:
function MyComponent() {
  console.count("Render counter");

  return <p>A simple component</p>;
}

Note: The label is optional, by default it will be "default".
Log error with assertion: console.assert
If you want to display an error message when a specific assertion is false you can use console.assert:
const useMyContext = () => {
  const myContextValues = useContext(MyContext);

  // You probably want to throw an error if it happens
  // It's only an example
  console.assert(
    myContextValue === undefined,
    "useMyContext has to be used below MyProvider"
  );

  return myContextValues;
};

Full description of elements: console.dir
You can use console.dir to display a more detailed description of things. When you use console.log to stringify a function, for example, it will only show you the function's properties, whereas console.dir will show you all of them:
function myMethod() {}

console.dir(myMethod);

Improve readability: console.group
It can be difficult to keep track of all of your logs if you have a large number of them. Thankfully, console.group is here to help.
function myMethod() {
  console.group("My method optional label");

  console.log("Log that will be group");

  console.info("With this one");

  console.error("And this one too");

  console.groupEnd("My method optional label");
}

myMethod();

console.log('Outside log');

Note: It's possible to nest console.group. The label is totally optional but can really help you with debugging.
Make a nice table: console.table
You can use console.table to display data inside a table. The data to be displayed is the first parameter (an array or object). The second is the number of columns to display (optional parameter).
console.table(
  [
    {
      name: "First algo",
      duration: "3.2s",
      other: "Hello",
    },
    {
      name: "Second algo",
      duration: "4.1s",
      other: "Guys and girls",
    },
  ],
  ["name", "duration"]
);

Make timers: console.time
You can use performance.now() to see how long a method takes to run, but console.time() , console.timeEnd(), and console.timeLog() are also useful:
function myMethod() {
  console.time("A label");

  // Do some process

  // If you want to log the time during the process
  console.timeLog("A label");

  // Other process

  // Will print how long the method takes to run
  console.timeEnd("A label");
}

myMethod();

Note: The label is optional; the "default" label will be used. You can't start a timer with the same label as another timer that's already running.
Display stacktrace: console.trace
If you wish to see where your function was called, use console.trace to see the stack trace:
function children() {
console.trace('Optional message');
}
function parent() {
 children();
}

parent();

Which terminal command is your personal favourite? Please feel free to like and comment.

